
The Fibonacci Sequence and The Golden Ratio
by
The Fibonacci numbers or Fibonacci sequence are the numbers in the following integer sequence 0, 1, 1, 2, 3, 5, 8, 13, 21, 34,.... The next number in the sequence is found by adding up the previous two numbers. For instance, 2 is found like 1+1= 2, and 3 is found like 1+2= 3. Please see the next video (https://www.youtube.com/watch?v=aB_KstBiou4).

Fibonacci numbers are in the real life. The Fibonacci is named after the mathematician Leonardo Fibonacci. He stumbled across it in the 12th century while contemplating a curious problem.
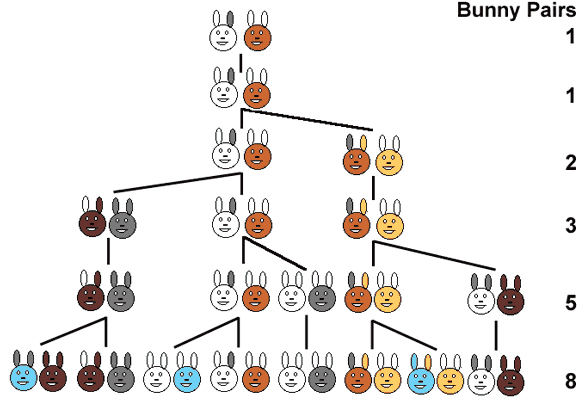
Leonardo Fibanacci was dealing with a very hypothetical situation. He assumed that rabbits reproduces always as a pair, one male and one female in each month, but this is not possible always. Let examine this hypothetical problem:

Fibonacci started with two baby rabbits, and one of which is boy and another is girl.

In one month, they grow up.

The next month, two more babies a boy rabbit and a girl rabbit were born.

In one month, they grow up and, a boy rabbit and a girl rabbit were born.

The next month the two adult pairs each have a pair of baby rabbits and the babies from last month mature.
Fibonacci asked how many rabbits a single pair can have after a year with this highly unbelievable breeding process. He noticed that the number of adult pairs in a given month is the total number of rabbits (both adults and babies) in the previous month (https://plus.maths.org/content/fibonacci-sequence-brief-introduction). Please see the next figure to see the rise in the number of rabbits and its relation with Fibonacci numbers.

We can generate a Fibonacci sequence in the first column using F(0) = 1, F(1) = 1, so generally we can say that F(n) = F(n-1) + F(n-2). By using the spreadsheet let us see some of the Fibonacci numbers in a sequence. The spreadsheet is a utility tool that can be adapted to many different explorations, presentations, and simulations in mathematics. There are spreadsheets available on almost any platform. An essential feature should be the ability to make graphs and charts from the matrix of data (http://jwilson.coe.uga.edu).

Figure I
By using the Spreadsheet, the purpose is to obtain the sequence of the Fibonacci numbers. By using these numbers different and interesting investigations can be done. Some terms of the Fibonacci Sequence were generated and then the ratio of each term to the previous term is calculated as it is seen in the Figure I.
It is also important to investigate the other relations through the Fibonacci sequence. Please see the next figure.

Figure II
In the Figure II, I am just starting one row below from the first one. Then For each cell, I am calculating the ratio of the previous two cells such that for the cell B2, I need to take the ratio of the cells A2 and A1 such that A2/A1= B2, A3/A2= B3, and so on. In the second column, it is crucial to notice that ratio is closing to the number 1. 618033999. After a while, it is always same. This number is really familiar, is not it? The corresponding graph below indicates this ratio as well.

Graph I
If you are wondering how to draw this graph and fill the spreadsheet cells please see the next tutorial.
As it is seen in the figure and chart that the ratio of the cells are approaching the number 1.618. Actually, the first column represents the Fibonacci numbers.

Now by using the Recurrence Method, we can investigate the golden ratio by using the Fibonacci sequence (You can see this document: Fibonacci)

Figure III

As well as this amazing result, it is possible to investigate different relations by using the Fibonacci sequence.
The same strategy for the ratios are applied to the Fibonacci numbers in the each cell. Please see the third column here, A3/A1= C3, A4/A2=C4,.., An/An-2= Cn. In the C column the ratio is closing to the number 2.61. Is that number another amazing number? In the D column A4/A1= D4, A5/A2= D5, ..., An/An-3=Dn, and the limit is approaching 4.236 as n is approaching ∞. The same mindset for the each column is continuous.


In general terms, it is anticipated that:

Let us prove this by using mathematical induction.

Now, it will be checked for p= k+1 whether it holds or not.


As well as Fibonacci sequence, when we look at the Lucas numbers which are the sequence of integers such that:


Figure IV
Now let write the Lucas numbers to the first column of the spreadsheet. These numbers in sequence are 2, 1,3, 4, 7, 11,18...In the second column, the ratio between the cells such that A2 and A1 is the equation for the cell B2. When we continue to take the ratio of these determined cell, the numbers in the B column are closing the number 1.618 that is the golden ratio


Now let's see its graph.

Graph II
The limit is approaching 1.618 as n is approaching infinity similar to the Fibonacci numbers.
In these examples, we notice the miracles of the Fibonacci and Lucas Numbers.